How to Reimagine Your Weather Graphics with Chyron Weather
In today’s article, we want to introduce you to Chyron Weather – our state-of-the-art weather visualization and storytelling platform. Chyron Weather introduces major advantages to the world of weather forecasting – total data flexibility, one-of-a-kind MOS workflow, and an overall lower total cost of ownership – and we have plenty to share on those topics in the coming weeks. But today, we want to break the ice with an overview of Chyron Weather’s state-of-the-art weather visualization and storytelling tools. Because we get it, the look and feel of your show is always priority one.
Here are the ways that Chyron Weather drives weather graphics that give you the visual-edge to captivate your audience:
Customizable, Data-Driven Weather Graphics
At its core, Chyron Weather provides the professional meteorologist graphics tools to create a compelling forecast. Graphics are data-driven. However, the data you use can come from virtually any source. Chyron Weather doesn’t restrict you to a specific data provider. You can select your private weather service provider or government meteorological office of choice – or any combination of both!
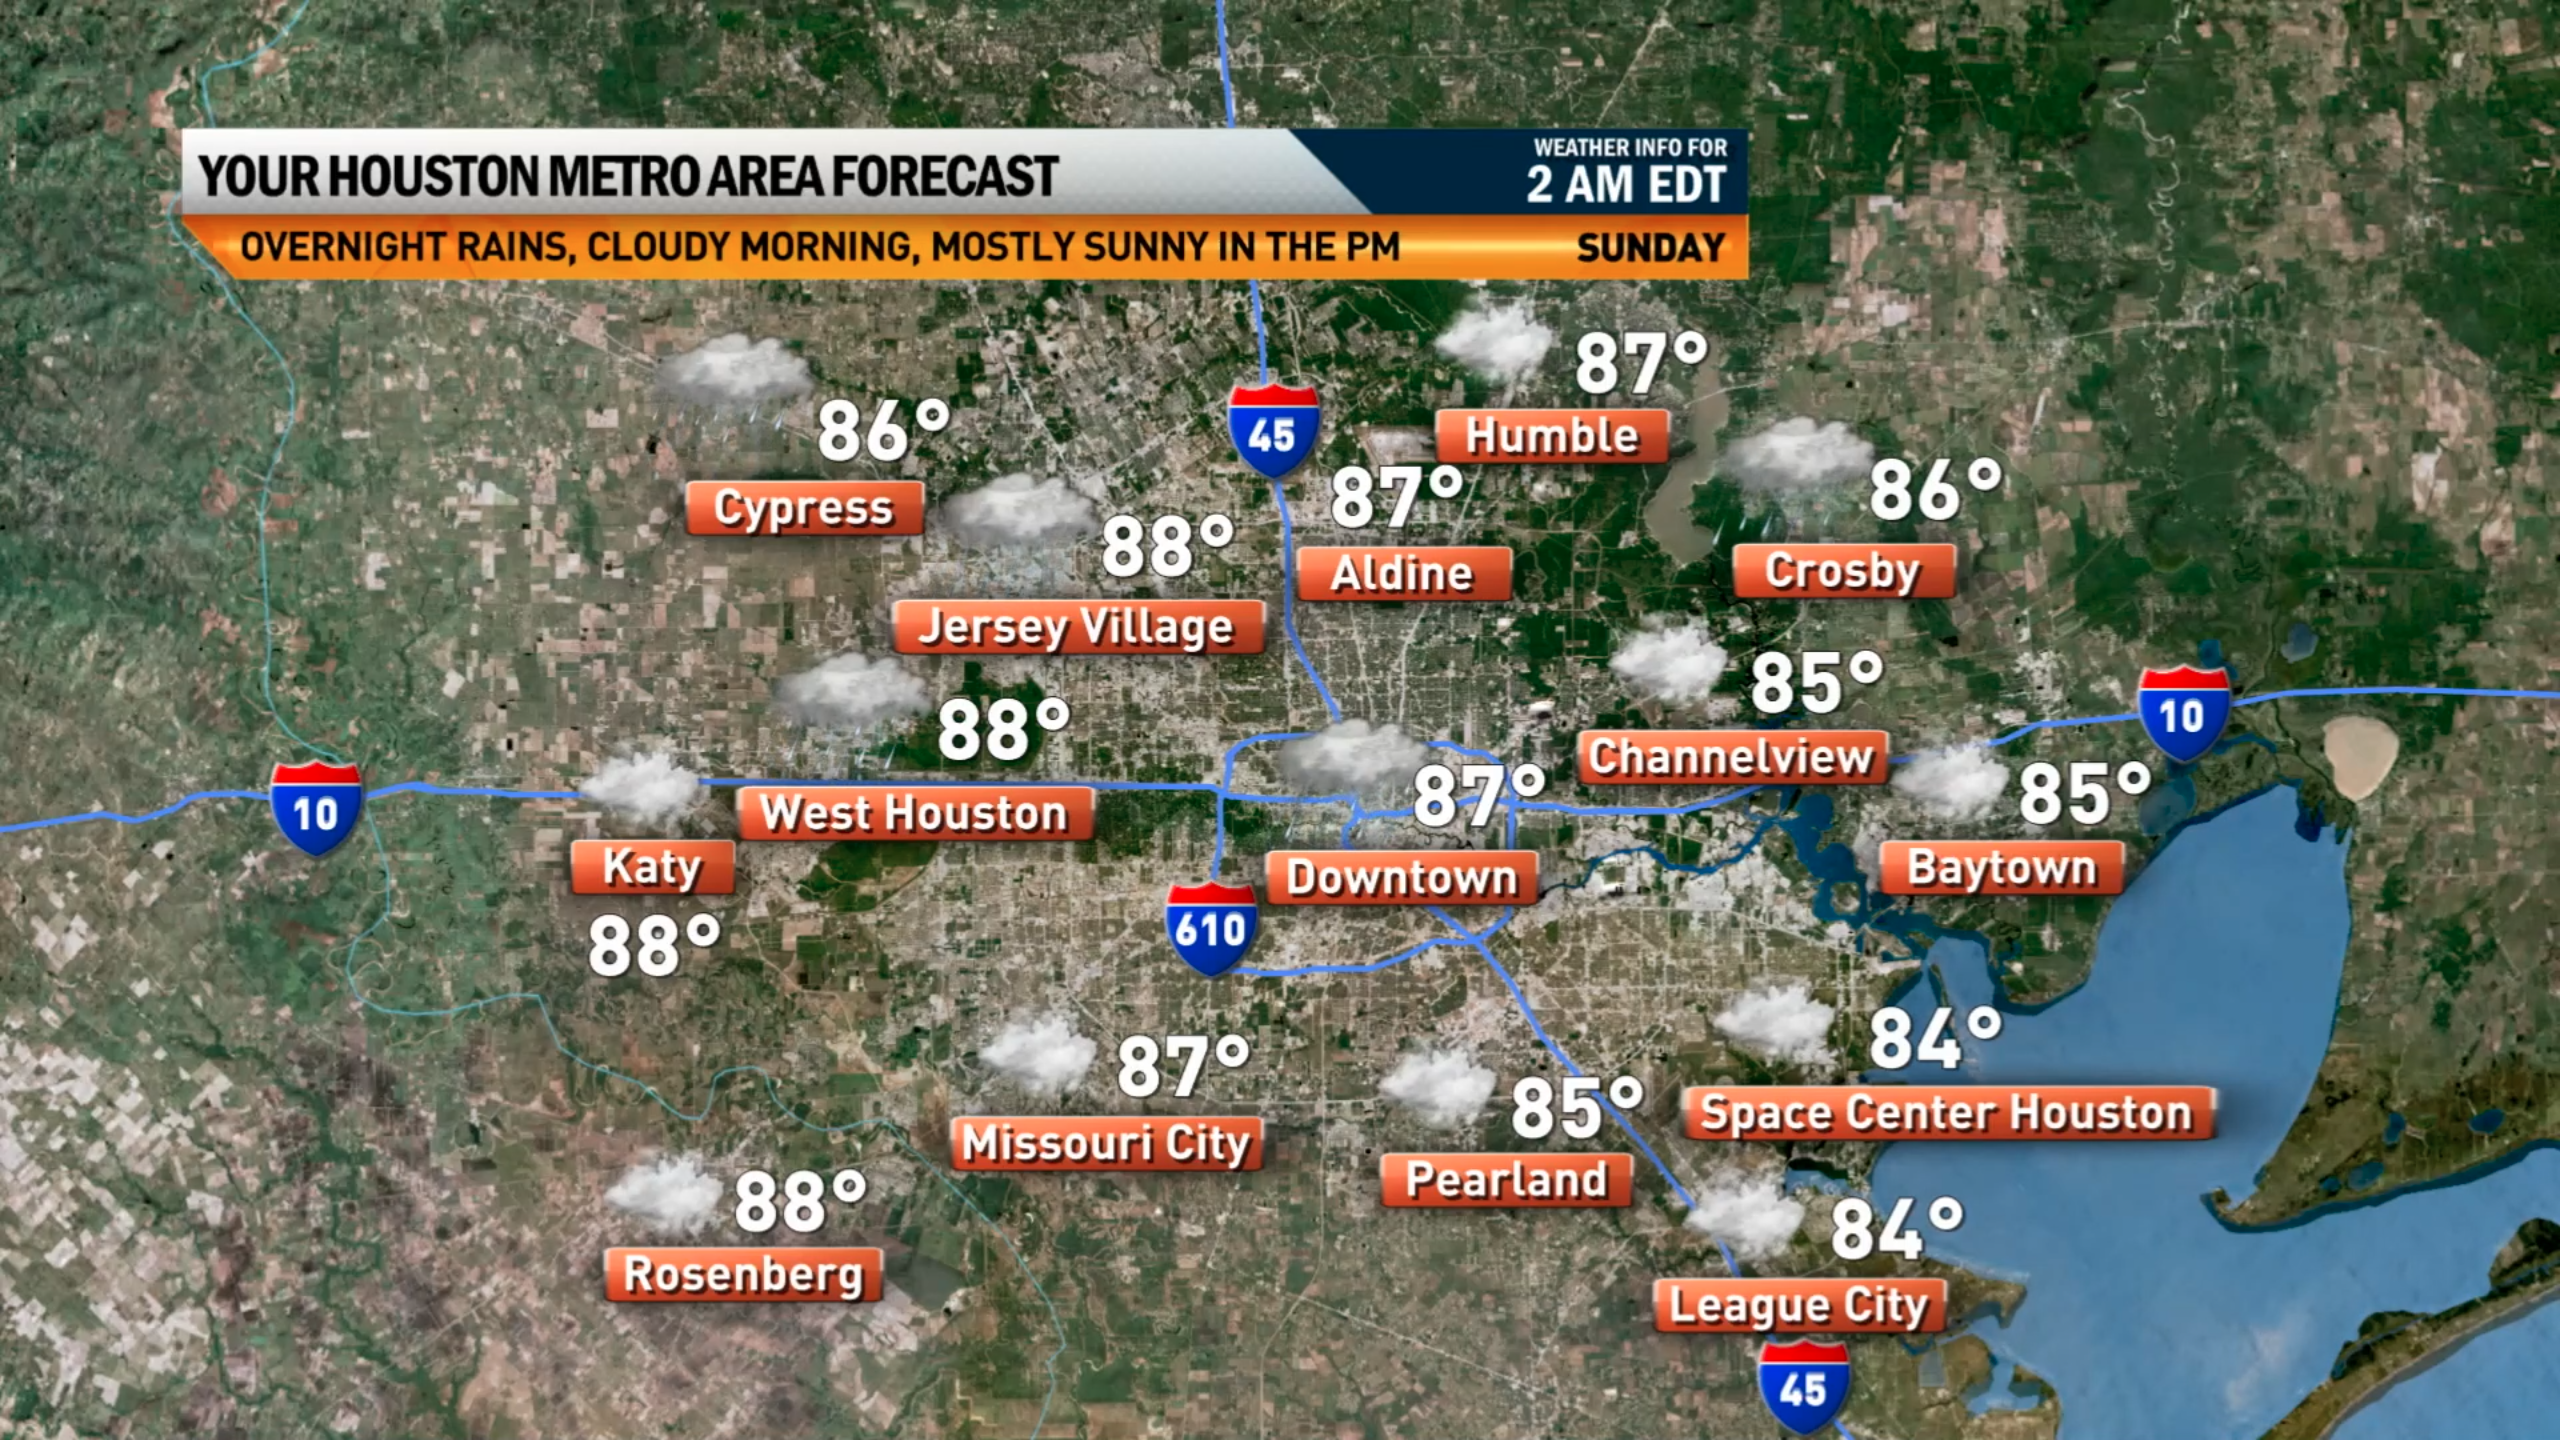
When your data source is connected, the different weather information translates into pre-built graphic formats.
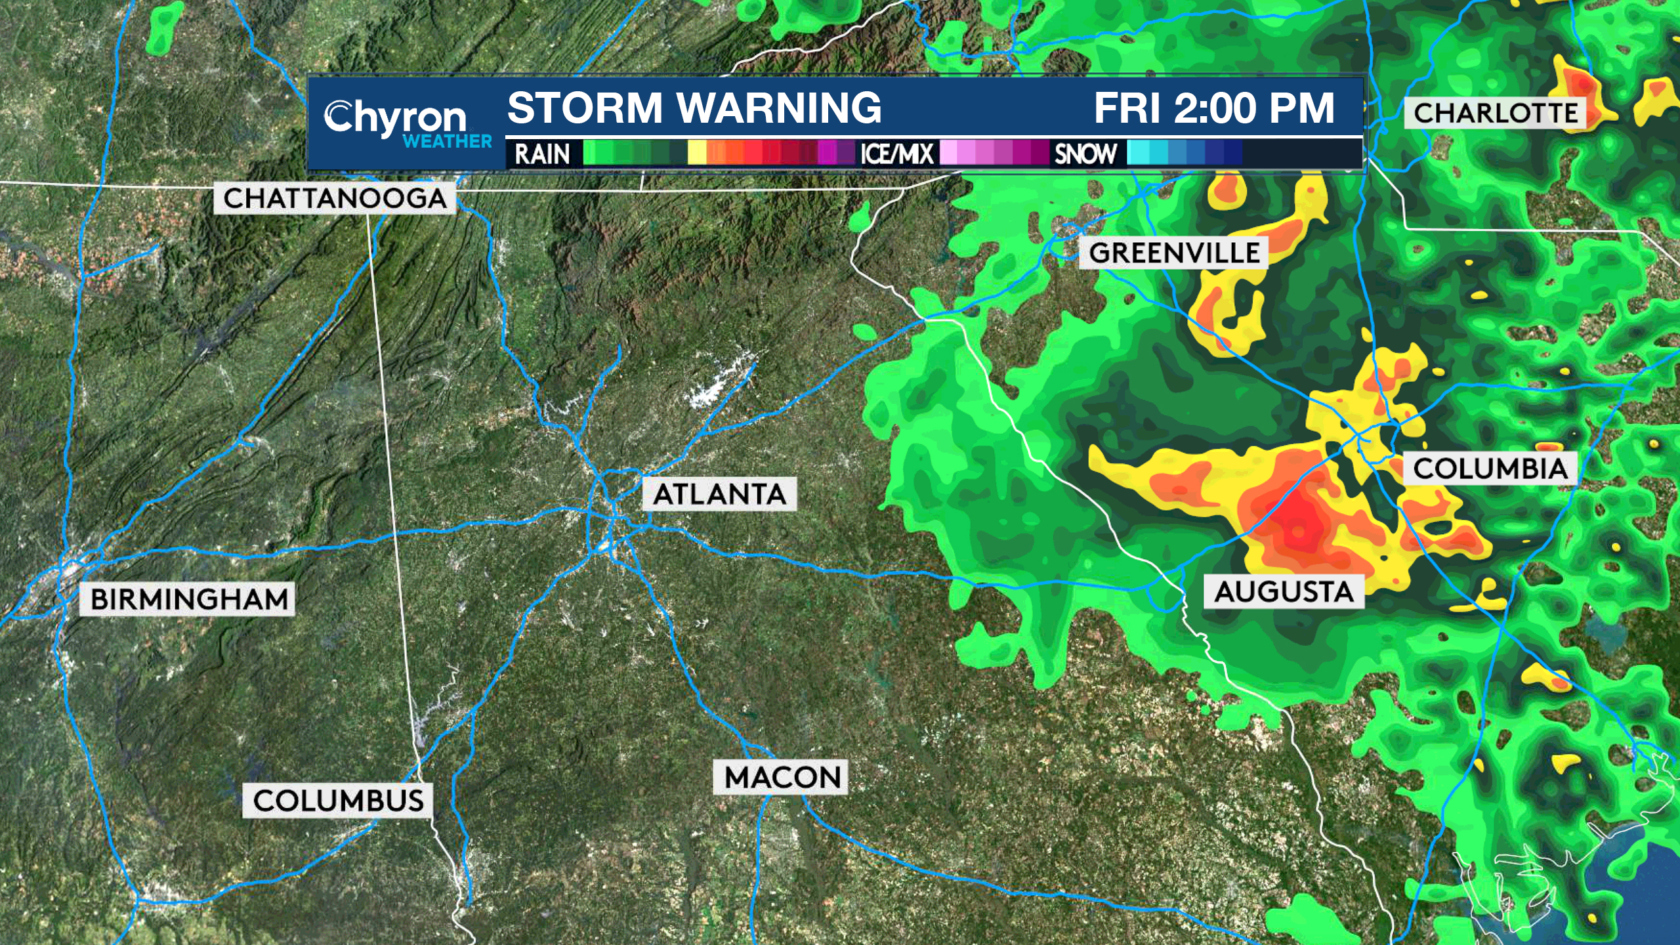
For map-based forecasts, there are dynamic visualizations to create an intuitive weather forecast sequence:
- Streamlines to show the direction and force of the wind
- Radar-based precipitation clouds that are color-customizable to highlight snow or ice, the intensity of the storm, and to give your forecast that unique look
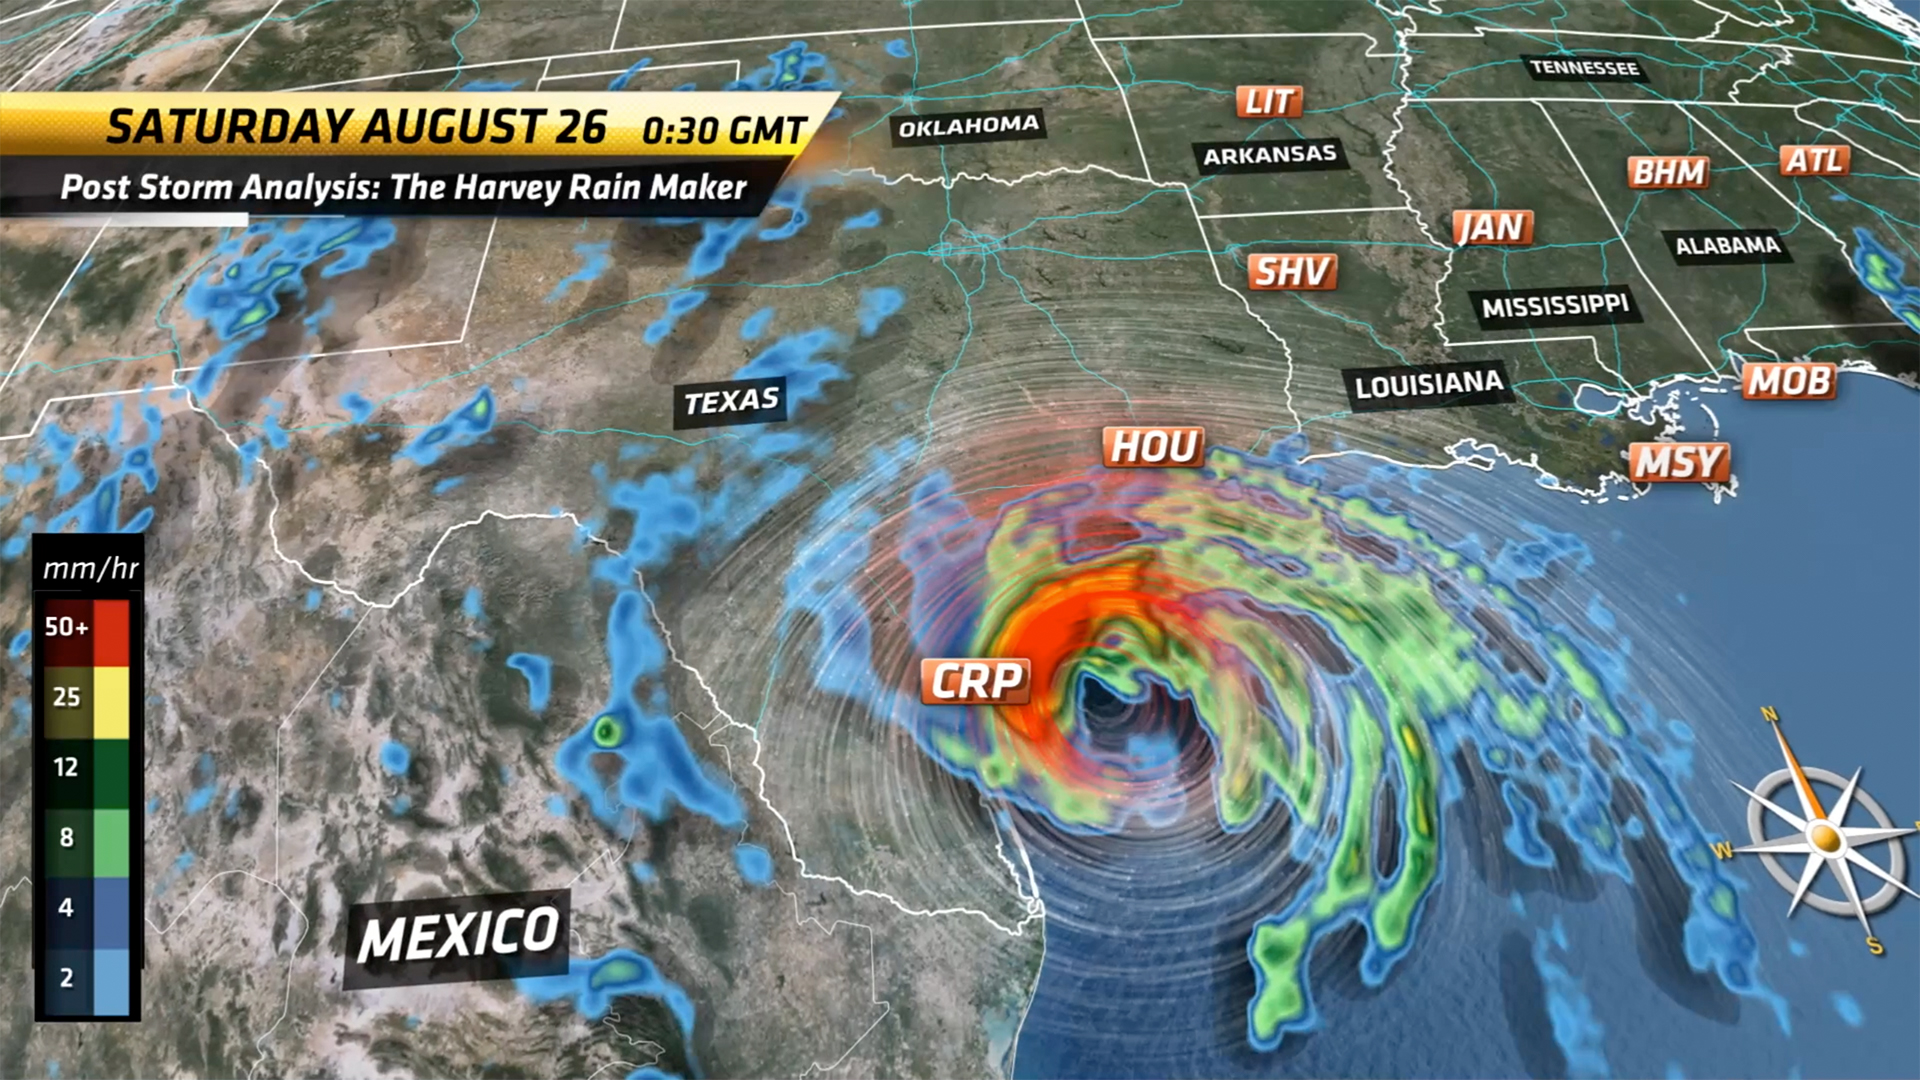
- Photorealistic elements such as volumetric clouds or satellite footage of an incoming hurricane
- Presenter-driven graphics such as weather icons, alerts, descriptions, and custom illustrations
You even have the option to extend your map-based forecasting beyond the traditional weather elements. Chyron Weather’s data-agnostic approach to forecasting allows customers to report on wildfire smoke, earthquakes, traffic events, air pollution, pollen levels, and even volcanic activity.
Additionally, The FutureScene functionality makes it easy to build a classic three- or five-day forecast graphic. Outline the numerical prediction data, weather icons, and the video/image background for your template. You can even enrich the graphic scene with dynamic weather elements such as rain, snow, or volumetric clouds based on the data of the day.
To see Chyron Weather graphics in action, visit the web page and watch the sizzle-reel.
While these are excellent tools for a meteorologist to flex their weather muscles with, the way Chyron Weather graphics handle data makes it easily accessible for your presenters, producers, and journalists. Many of the elements that dictate a sequence are replaceable. The location, the forecast period, the types of visual data on-screen, and even the color of the graphic elements can be changed by your editorial staff later in the process. Changes to factors such as location and forecast period reflect immediately in the data you present, making it easy to adapt hour-by-hour forecasting in any of your markets from a single template.
Holistic Weather Forecasting with Multiple Data Layers
Do you know what’s just as important as turning your data into great-looking weather graphics? The ability to combine data sources for a holistic forecast. The magic of meteorology is more than telling your audience what the weather is going to be – it’s showing them why it’s going to be that way.
Not only does Chyron Weather allow you to leverage any data source of your choosing. It also allows you to combine different categories of data into a single graphic sequence. Managing these graphic elements isn’t painful either, as all the visual components are layer-based. Just like Photoshop, After Effects, or even PRIME CG – it’s easy to manage multiple layers in a graphic and alter their properties. Add and remove graphical elements, weather visuals, and select the specific data that a given layer will display.
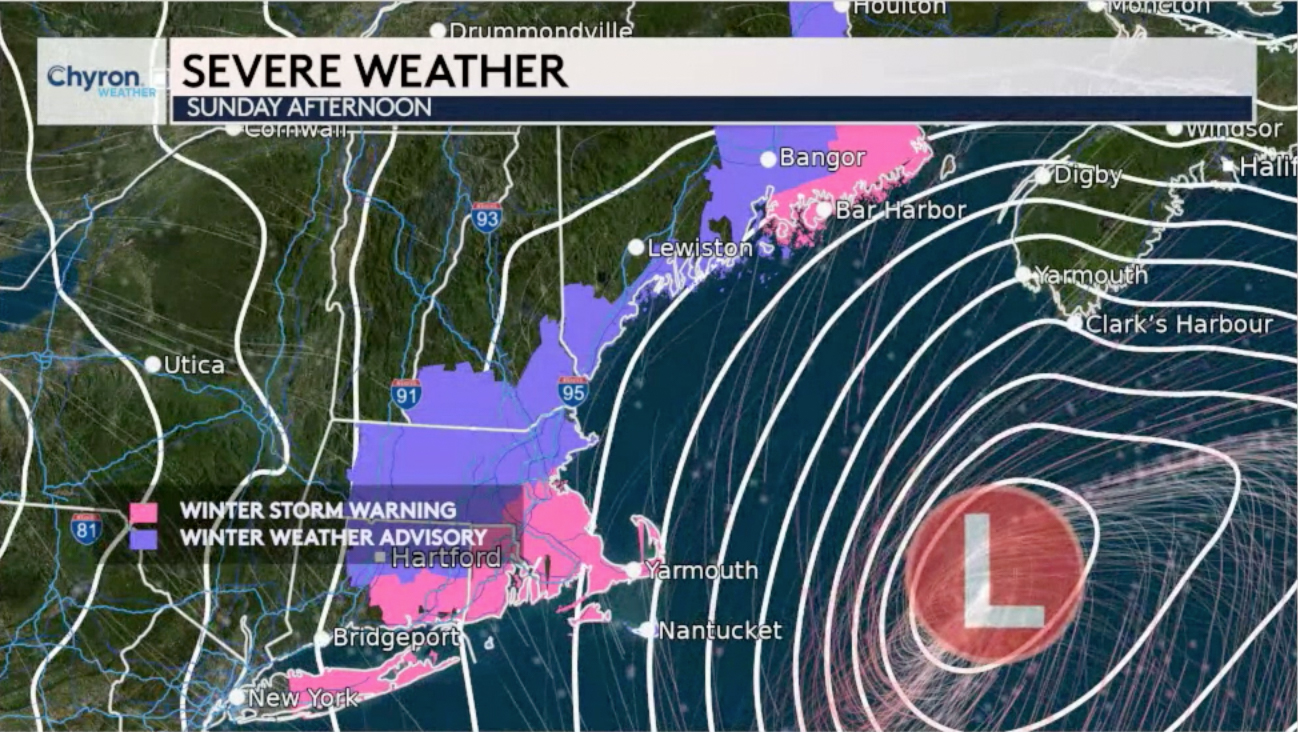
Given it’s the month of February, when many residents of the Northern Hemisphere will be contending with winter storm warnings and weather advisories – perhaps a snowy example is in order.
Say you want to highlight severe winter weather conditions along the coast of New England. You can pull-up your feed from the NWS (National Weather Service) and select the specific alert data that will be valuable for this forecast – namely Winter Storm Warnings and Winter Weather Advisories. Now, only those alerts will populate the graphic. If you have a legend indicating these alerts on the map, the legend will adapt to show only the data that is currently visible on-screen.
Let’s take it to the next step, combining different data sources for a holistic forecast. You want to illustrate WHY these weather alerts are happening in New England. You can add wind streamlines and surface pressure data from the NAM (North American Mesoscale Forecast System) to show airflow around the low-pressure center off the coast that’s driving this weather event. You also add an icon to better highlight this low-pressure center. Congratulations, you’ve just created a graphic that tells the entire story around the brutal storm your viewers are about to endure.
Your on-air presenter can explain how this low-pressure center off the coast drives moisture onto the cold land, which then freezes – creating a significant snow impact.
2D/3D Terrain Maps with Smart GIS Data
Another key component of your weather graphics is the base maps that they play out over. Chyron Weather utilizes high-resolution digital elevation models (built on 150m or 15m standard-satellite imagery) to facilitate news maps and weather graphics creation for any location on earth. You can leverage Bing Maps, OSG Earth, or any other base map provider that’s going to deliver your desired look. On top of these sophisticated terrain textures, we can also represent the other environmental elements of your region in higher-quality. Do a flythrough of your mountainous valley region with volumetric clouds lazily drifting overhead, or implement an enriched water texture for your coastal forecasts.
There’s also the opportunity to utilize highly-sophisticated and adaptive data on the base map itself. As you maneuver around the map in a Chyron Weather sequence, the system will pull GIS data from a designated map server to provide valuable geographical data elements for your scene. As you zoom-in from national, state, and municipal viewpoints – Chyron Weather will switch from major cities to smaller towns, show local interstate signs and roads, and show the relevant forecast data within these regions. This makes Chyron Weather an excellent system for fast-breaking news coverage where you need to rapidly zoom-in to an area of interest.
Engaging On-Air Weather Reporting
For many news broadcasters, the final performance of your weather graphics take place on the green-screen behind your weather presenter. Nothing looks better than a smooth, well-delivered presentation – which is why Chyron Weather keeps presentations simple. Weather reports are built by dragging and dropping sequences into a rundown, which your presenter can control remotely with a one-button clicker.
Sometimes, you want to extend the WOW-factor from the screen to your studio, and Chyron Weather has a few options to help you do just that. By interfacing with the PRIME platform, Chyron Weather graphics can go from the green screen to the touchscreen; or even as an Unreal augmented reality element in the middle of your studio. Extending the boundaries of traditional weather storytelling is a great way to excite and engage your audience.
Implement Your Station Branding and Sponsorship
The final advantage of Chyron Weather is you can make your weather programming into your own, visually and monetarily. This may not seem like an amazing technical feat, but some traditional weather systems can be highly-restrictive with branding implementation. With Chyron Weather, you can brand your weather forecast with your network or station ID, and craft the visuals to be a completely integrated part of your greater graphics footprint. Productize your weather segments in a way that delivers you the greatest return on investment with your sponsors. Use stationary clips, live video, or sponsor logos directly within your graphics to open-up revenue streams throughout your weather segments.
Our Weather Experts are Ready to Help You
Now that we’ve introduced you to the powerful weather visualization and story-telling capability of Chyron Weather, we have plenty more to share with you here on the blog in the future:
• How total data flexibility empowers your weather forecasting
• The advantage of MOS-integration in the weather space
• How you can lower the total cost of ownership of your weather graphics system
Subscribe to the blog to learn more on how Chyron Weather can empower your meteorologists, presenters, and editorial teams. If you have any questions or want to learn more now, feel free to contact our team.