The Power of Data-Agnostic Weather Forecasting
Data is the backbone of weather forecasting. The graphics that playout on-screen, the story your presenter is telling, and the very reason your viewers are tuning in – are all driven by the incoming weather data. Despite the critical role that data plays in your programming, traditional weather graphics systems can be surprisingly restrictive with the keys to the engine. Commonly, you’ll find yourself having to work with a small subset of potentially high-cost private data providers that may or may not provide all the data that’s compelling to your audience.
Chyron Weather is built from the bottom-up to be a data-agnostic weather graphics system. Meaning, you have the freedom to choose and utilize the specific data sources or packages that are going to deliver the most compelling story to your audience.
In today’s article, we’re going to examine the power of total data flexibility in weather storytelling and what it means for your live weather productions.
GET IN TOUCH WITH SALES
Giving Your Meteorologist the Keys to the Ferrari
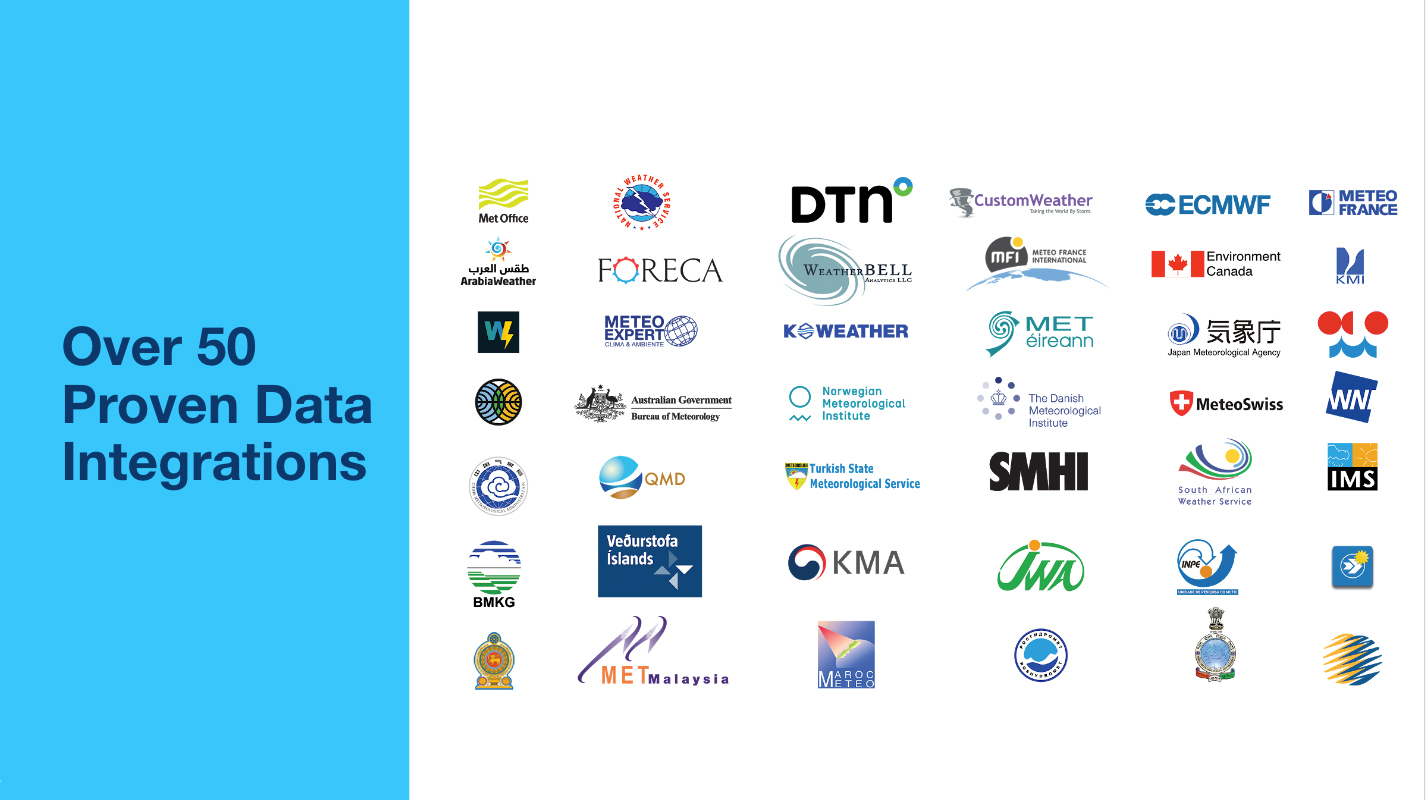
First and foremost, the freedom to utilize any data source starts at the ingest level. Chyon Weather can bring in any combination of data sources you need to craft your weather stories. Of course, this includes your industry-standard private data providers who aggregate the data on your behalf, to streamline timing and implementation. We recognize these are important. To that end, our Chyron Weather team recently entered into a long-term partnership with DTN to acquire their Weather Suite platform and deliver the best combination of weather data and graphics. However, Chyron Weather lets you go a step further with access to publicly-available data sources, for instance, national meteorological offices like the NWS (National Weather Service).
For skilled meteorologists, this is a bit like getting the keys to the Ferrari. The majority of the driving you’re going to do is the day-to-day commute that an average car could handle, but when the opportunity to open the engine up and go 180 miles-per-hour presents itself – there’s nothing quite like it. Wherever you are in the world, there are weather events that are going to have significant impacts on the day-to-day lives of your viewers. Your meteorologists don’t just want to relay what the weather is; they want to educate and inform viewers on the factors behind the weather. Chyron Weather is the engine that will allow your meteorologists to shine.
Say in addition to the existing radar-data you receive from your turnkey provider – you want to visualize specific text warnings and environmental hazard data from NOAAPORT (the National Oceanic and Atmospheric Administration’s broadcast system for real-time data). Well, now you can do just that! Connect to the system, ingest the data, and implement it into your graphic sequence. By freeing your meteorologists to utilize the variety of data sources they need to tell a holistic story, your weather forecasts will become far more engaging to your audience.
Great Weather Graphics, Greater Cost-Savings
For your news network, this is an opportunity to maximize audience engagement and cost-savings. Whether you’re a major network broadcaster or a local TV station, you’re able to choose the private and public weather data sources that you trust and will tell a compelling story to your audience. How you tailor this public/private mix can also make significant improvements to your bottom line. For instance, you can maximize your usage of free government data (thank you, taxpayers!) and then purchase high-quality localized data as you deem necessary. Conversely, you might decide for the sake of simplicity to work with a single, one-stop provider like DTN for the bulk of your data, but implement a few public sources here and there to slightly-trim down your budget. The point is, you’re crafting a weather graphics solution that’s catering to your needs, not the other way around.
Don’t forget, our Chyron Weather team is here to help. We can vet your data of interest before plugging it into the system and collaborate to craft the combination of a-la-carte sources and turnkey providers that are optimal for your budget.
Keep Complex Weather Storytelling Simple
Leveraging a variety of data sources can help you breakdown a complex weather story in a way that informs, educates, and entertains your audience. However, this doesn’t mean the behind-the-scenes work has to become equally complex for your meteorologist. Chyron Weather’s data flexibility extends from ingest to graphics creation. Any data source rapidly translates into a relevant template-based weather graphic. Once a data source connects to the platform, it becomes accessible as a layer within the graphics-building interface. It’s easy to combine multiple data sources within a single graphic as well. You can add, order, and remove data from your weather graphic however you see fit.
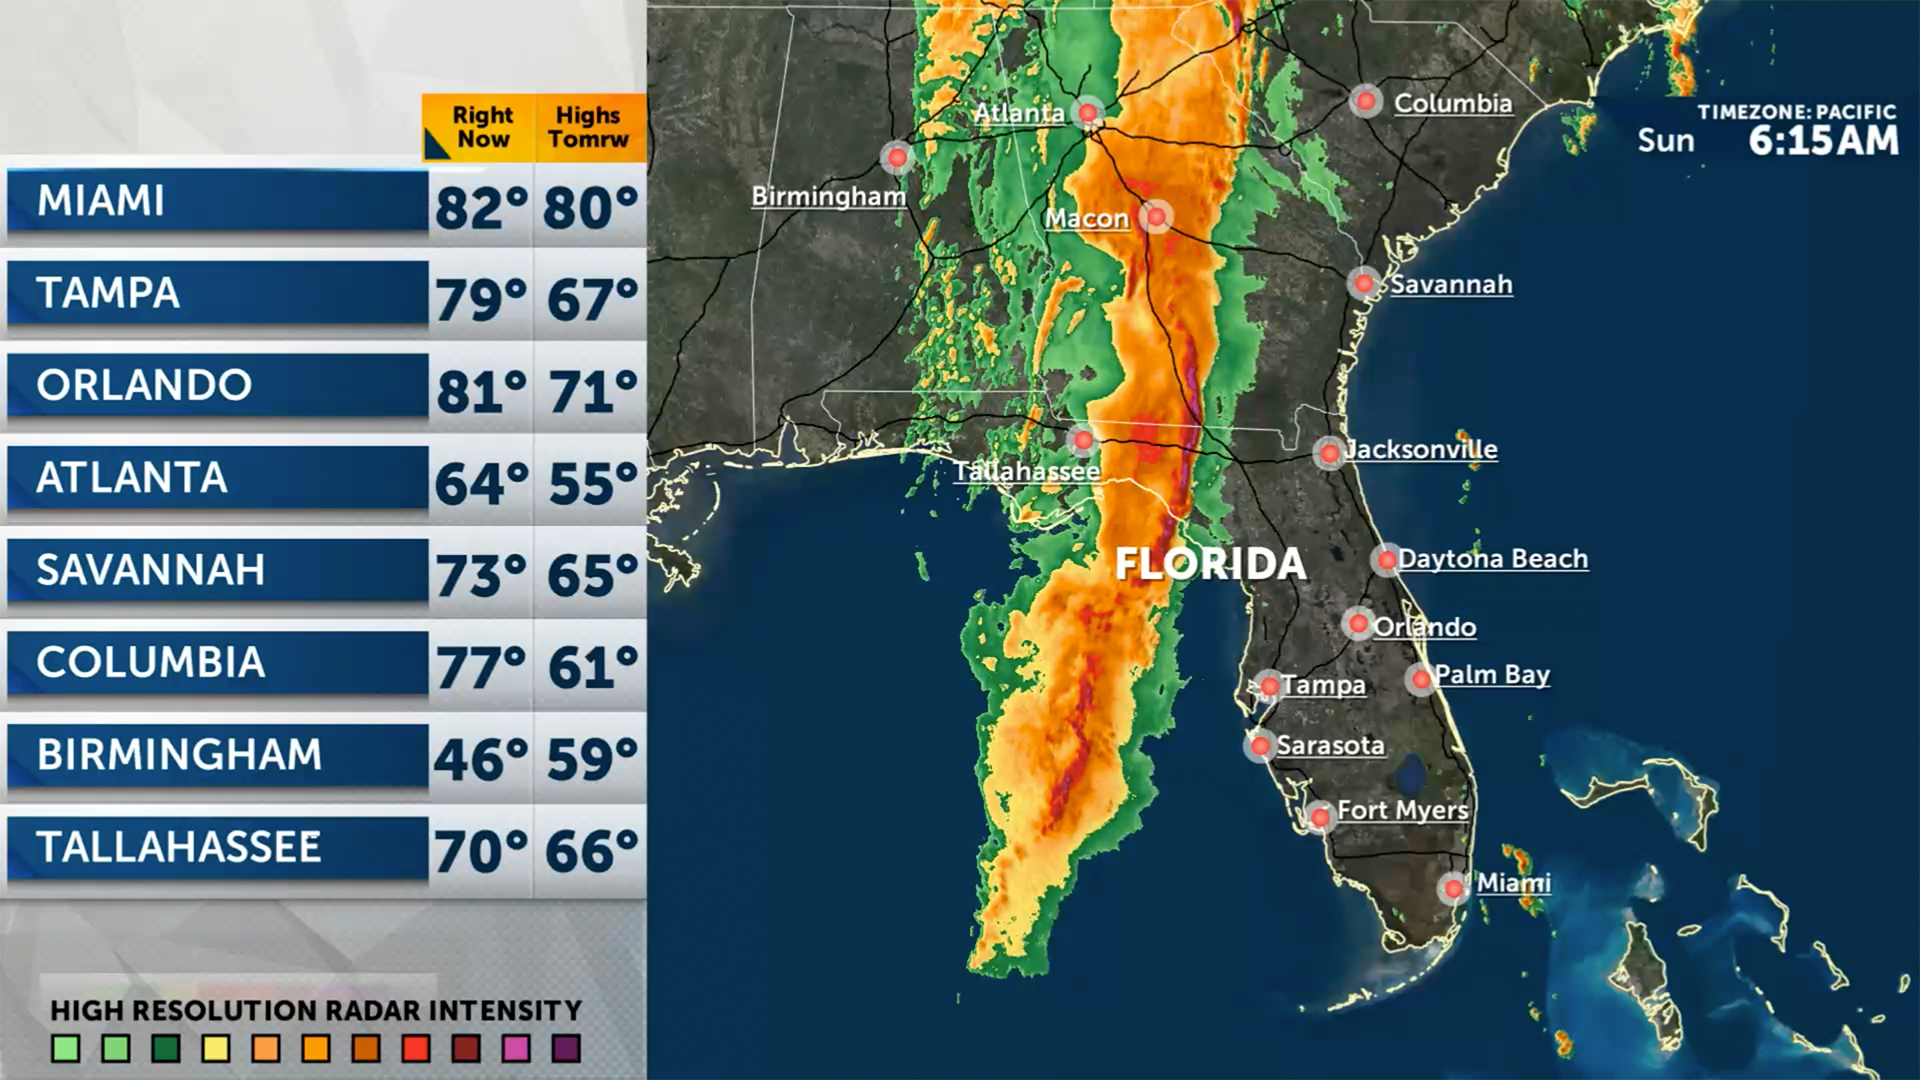
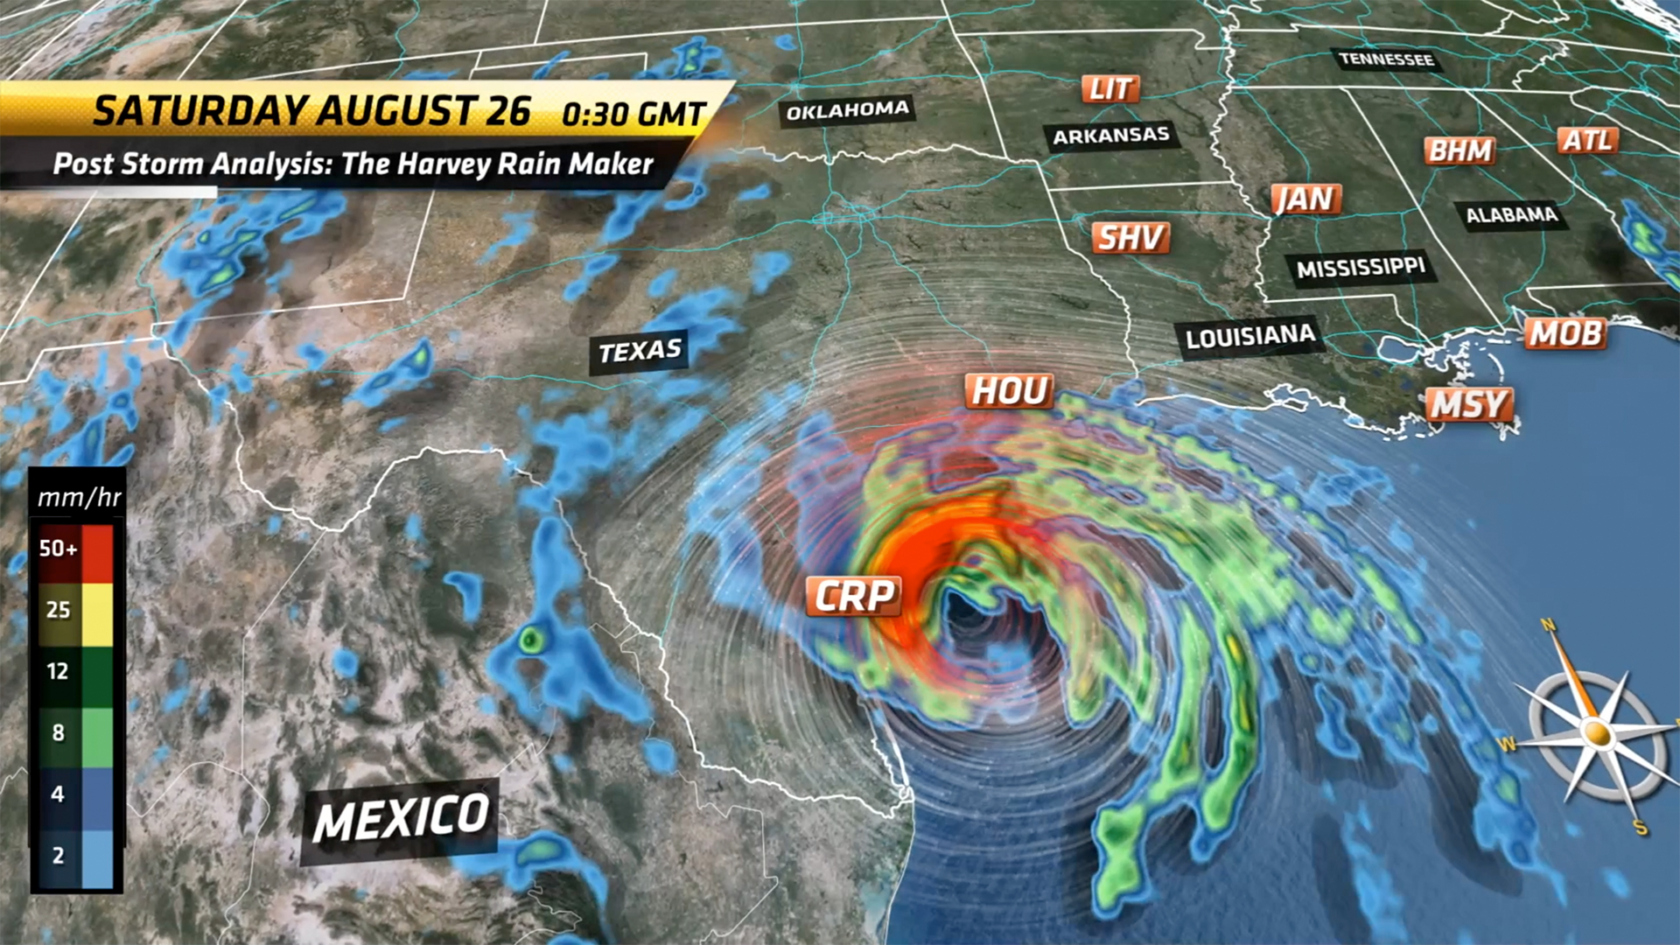
There’s also a lot of flexibility in how you display the data in your weather graphic. For example, in the image above, we’re combining a visual map-based forecast with numerical observed weather data. In this instance, the precipitation radar and “tomorrow’s weather” are coming through a private data provider, while the “current temperature” value is from the NWS airport feeds in each city. With Chyron Weather’s advanced data aggregation happening under the hood, the user experience is one where data just flows naturally into the platform.
Extend Map-Based Forecasting Beyond Weather
People love visual storytelling, which is why the weather forecast has become such a staple of news broadcasting. Now, you can apply the same eye-catching techniques of a weather forecast to other data-driven stories. Chyron Weather provides interfaces for non-weather-related data to facilitate real-time ingest of reports on earthquakes, fires, traffic events, pollen, pollution, and volcanic data. You can get a start on building most of these graphics right away, as Chyron Weather includes out-of-the-box data models to showcase these special events.
Don’t forget you can combine different data sources within a single graphic to tell a holistic story. Take the case of flooding’s effect on local traffic conditions, you can combine the two of them in a single map-based graphic to paint a clear picture. Of course, all this is happening through a system for high-resolution, fluid weather graphics – so it looks great too!
Integrate Your News Ticker and Weather Graphics
Another advantage of freeing your weather forecasting from data restrictions is you can facilitate tighter integration between your weather graphics platform and your news ticker. Generally, news tickers use public sources such as the NWS for severe weather alerts. You can plug the same data source you’re using for your news ticker into Chyron Weather for a seamless transition from a breaking severe weather alert in your lower-third station crawl, to a visual map-based forecast. With a dynamically-editable, template-based approach to weather graphics – Chyron Weather can quickly adapt to this scenario.
From Chyron’s NewsTicker system – which is continually updating with new graphics and information – you can export content to Chyron Weather for inclusion in your weather graphics, ensuring brand and content consistency across platforms. This consistency is hugely valuable when you’re trying to maximize the monetization of your weather programming. Create sponsored station IDs that display the time + weather and sell weather segments to different sponsors – say your five-day forecast. You can even automate your advertising based on weather thresholds and conditions (pro-tip: automotive manufacturers love to promote their latest, greatest, most rugged 4×4 trucks during blizzard season). Ultimately, you’re able to make more money without having to take a commercial break. What viewer isn’t going to love that?
What’s the Ideal Data for Your Weather Forecast?
We said it before, and we’ll say it again – data is the backbone of weather forecasting. By freeing your weather graphics from data restrictions, you can empower your meteorologists to tell captivating stories. With great freedom comes greater profitability, in the form of lower cost-margins on your data sourcing and new revenue/sponsorship opportunities through smart integration with your news ticker and newsroom workflow.
What’s the ideal data for your weather forecast? Contact the Chyron Weather team! We’re happy to help you find out.
GET IN TOUCH WITH SALES